With all the hubbub surrounding PowerPivot, I have been given the task of learning DAX: not an easy task when the product is still pre-release and there aren’t any step-by-step books on hand! With a list of functions and a vague understanding of how they work, plus powerpivotpro’s very helpful posts, I decided to set myself a problem that I could hopefully solve with DAX. I noticed that in the long list of DAX functions, standard deviation and correlation were missing. As I have had to use these fairly frequently in MDX (along with various derivations of such), I decided I would try to set up a correlation measure in a powerpivot pivot table. In the process, I discovered some interesting nuances to DAX, one of which is the topic of this blog post. It should be fun for ALL()!
According to this handy dandy list of DAX functions, the ALL() function is simple enough. The syntax is ALL(table_or_column) and it returns “all the values in a table, or all the values in a column, ignoring any filters that might have been applied.” Let’s see it in action.
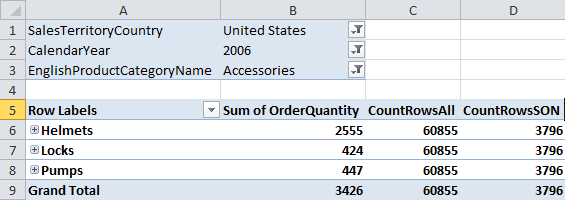
I have created a powerpivot workbook that I have loaded with some AdventureWorks data. On rows I have product subcategories and product, on columns I have OrderQuantity and some measures I created, CountRowsAll and CountRowsSON. I’ve filtered my dataset down to the year 2006, the United States sales region, and the product Category Accessories.
The CountRowsAll measure counts the rows in the FactResellerSales table and has the formula:
=CountRows(All(FactResellerSales))*if([Sum of OrderQuantity]>0, 1, [Sum of OrderQuantity])
The CountRowsSON measure counts the rows in the SalesOrderNumber column of the FactResellerSales table and has the formula:
=CountRows(All(FactResellerSales[SalesOrderNumber]))*if([Sum of OrderQuantity]>0, 1, [Sum of OrderQuantity])
What about the if() statement? Well, because the count of the rows will be the same for all products and product subcategories, we would get a LOT of rows in our pivot table. The if() statement multiplies our row count by 1 if the OrderQuantity is > 0 (not null), else it multiplies it by the OrderQuantity (which should be null). There is no “nothing” or “null” object I could find in DAX so doing it this way is a cheat that helps me eliminate extraneous product rows that otherwise have no data. It keeps my table looking neat and tidy.
When a run a simple SQL query on my AdventureWorks database I find that the FactResellerSales table does indeed have 60855 rows. Now, notice that the CountRowsSON does NOT have 60855 rows even though it is pulling from the same table. This suggests that the ALL() function does not bring back duplicates, it is a distinct ALL function. This is confirmed when we query the database for distinct SalesOrderNumbers from FactResellerSales.
Now I will create two new measures, that will sum up the OrderQuantity over All(FactResellerSales) and All(FactResellerSales[SalesOrderNumber]).
The first measure is called CountAllSales and has the formula:
=SUMX(All(FactResellerSales),FactResellerSales[Sum of OrderQuantity])*if([Sum of OrderQuantity]>0, 1, [Sum of OrderQuantity])
The second measure is called CountAllSalesSON and has the formula:
=SUMX(All(FactResellerSales[SalesOrderNumber]),FactResellerSales[Sum of OrderQuantity])*if([Sum of OrderQuantity]>0, 1, [Sum of OrderQuantity])
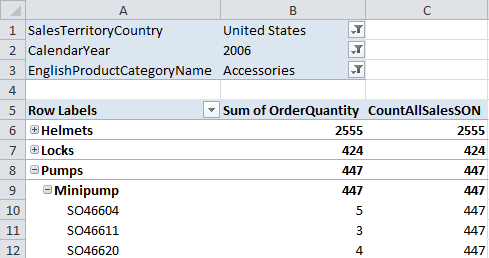
Our table now looks like this:
CountAllSales has the same number for every row, which is to be expected. It is the sum of all OrderQuantities over the whole FactResellerSales table. However, our CountAllSalesSON measure matches our Sum of OrderQuantity measure! It changes depending on the row! But we know that the All(FactResellerSales[SalesOrderNumber]) is bringing back all the SalesOrderNumbers from the FactResellerSales table for each row, so what is going on here? I thought the ALL function ignored all filters?
Well, it does! But our measure, Sum of OrderQuantity, doesn’t. The answer lies in context. When we bring back the full FactResellerSales table, we are bringing back all the information for each row, productkey, orderdate, everything. So the Sum of OrderQuantity is figured on each row using all that information. But when we bring back just the SalesOrderNumber column, we don’t have all that other info, and the measure needs that. So it figures it out from what other context is available, namely the product values on rows and the filters applied to our pivottable.
This is just like when we have default members in MDX. The following MDX query displays the same order quantity data as in the second pivot table:
with
member Measures.OrderQuantityAll
as ([Measures].[Reseller Order Quantity], [Product].[Product Categories].[All], [Date].[Calendar Year].[All], [Sales Territory].[Sales Territory Country].[All])
select {Measures.OrderQuantityAll, Measures.[Reseller Order Quantity]}
on columns,
Nonempty([Product].[Product Categories].[Accessories].Children,Measures.[Reseller Order Quantity])
on rows
from [Adventure Works]
where([Date].[Calendar Year].&[2006],[Sales Territory].[Sales Territory Country].&[United States])
When we defined Measures.OrderQuantityAll, we overrode the context of the Product CurrentMember, the Date CurrentMember, and the Sales Territory CurrentMember that are defined elsewhere in the query, be it on rows or in the where clause. Those would otherwise be our default members. When we pull the full FactResellerSales table with the ALL function in our pivot table, we are doing something similar. We now have all that info and that overrides what would otherwise be our default members – the context on rows. When we just pull the SalesOrderNumber column, we don’t have any of that info and so the pivot table uses the context on rows.
One more thing I want to note – what happens when we put SalesOrderNumber on columns? We get this:
Notice that while Sum or Order Quantity changes with the SalesOrderNumber, CountAllSalesSON doesn’t. Because we are summing over all the SalesOrderNumbers.
When is all this useful? Remember when I said I started playing with DAX by calculating standard deviations and correlations? In order to do those calculations, you need the means over the set, and then you need to find the difference between each individual data point and that mean. Replace CountAllSalesSON with an Average instead of a Sum, and you have a way to define that mean for each row, which allows us to then calculate our standard deviations and correlations. I will go into further detail in a future post.


6 Comments
Very nice and thanks for sharing and explaining all of the results. Excellent job!
[…] the rest here: Erika's BI Blog » A Treatise on the ALL() Function in DAX – or … By pivot | category: pivot, pivot table | tags: count, lot, order, pivot, pivot table, […]
HI Erika,
Excellent post! Just wanted to mention there is a way to check if values are empty by using the ISBLANK() function.
Kasper de Jonge
You can return the equivalent of a null by using the BLANK() function.
I have started using DAX and was happy to find this article. Using the slicers and returning 0 for a ratio % did not filter/disable as expected, however, returning blank when the denominator is 0 works perfect.
Erika's BI Blog » A Treatise on the ALL() Function in DAX – or – ‘Is it all er nuthin’ with you?’ is an interesting name for a blog, keep up the good work, thanks, from Lenore Jacobs